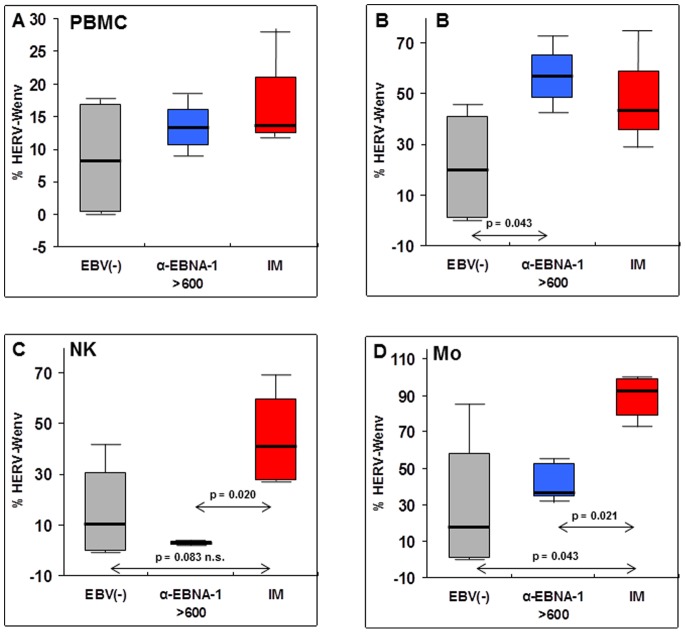
Figure 2. Presence of HERV-Wenv protein on the plasma membrane of PBMC subpopulations from IM patients and controls.
Flow cytometry evaluation of alive PBMC from IM patients (IM) and healthy donors (HD), either with anti-EBNA-1 IgG titers >600 IU/ml or EBV− negative (EBV−). Data were evaluated as percentage of cells with HERV-Wenv-specific staining, as specified in Methods, and are expressed as medians (line), with maximum and minimum values (whiskers); boxes represent interquartile range of the samples. Statistical significance was evaluated by the Mann-Whitney U test for comparison of two groups. When not specified, differences were not significant. All samples (four for each group) were evaluated in the same day. (A) Comparison of HERV-W-specific staining of whole PBMC. (B), (C), (D) HERV-W-specific staining of PBMC subpopulations sorted by specific staining with anti-CD19, anti-CD16 and anti-CD14 antibodies, respectively.

