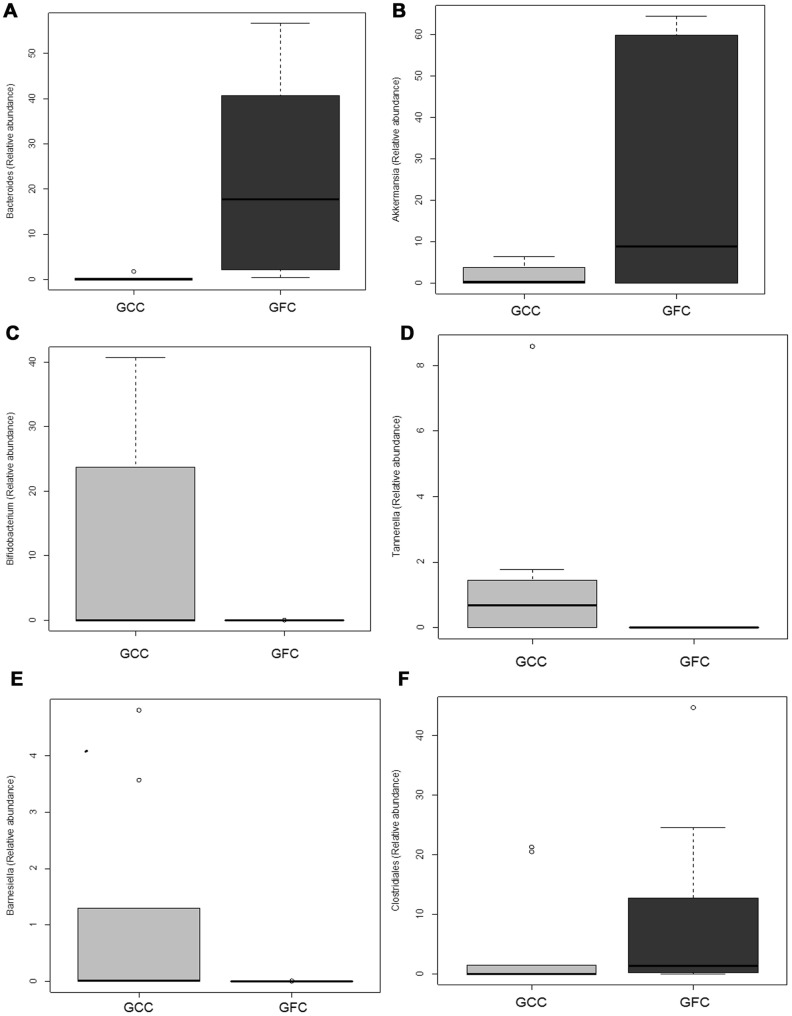
Figure 7. Effect of Dietary Gluten Upon Specific OTU (Genus) Abundance.
Mean relative abundance for each of 6 genera in all of the gluten-containing chows group (GCC) and gluten-free chows group (GFC) as in fig 5 are plotted in a box and whisker plot. The six genera plotted are A) Bacteroides, B) Akkermansia, C) Bifidobacterium, D) Tannerella, E) Barnesiella, F) Clostridiales. The respective p values are: A) 0.005843 B) 0.01783 C) 0.03615 D) 0.01761 E) 0.0234 and F) 0.0541.

