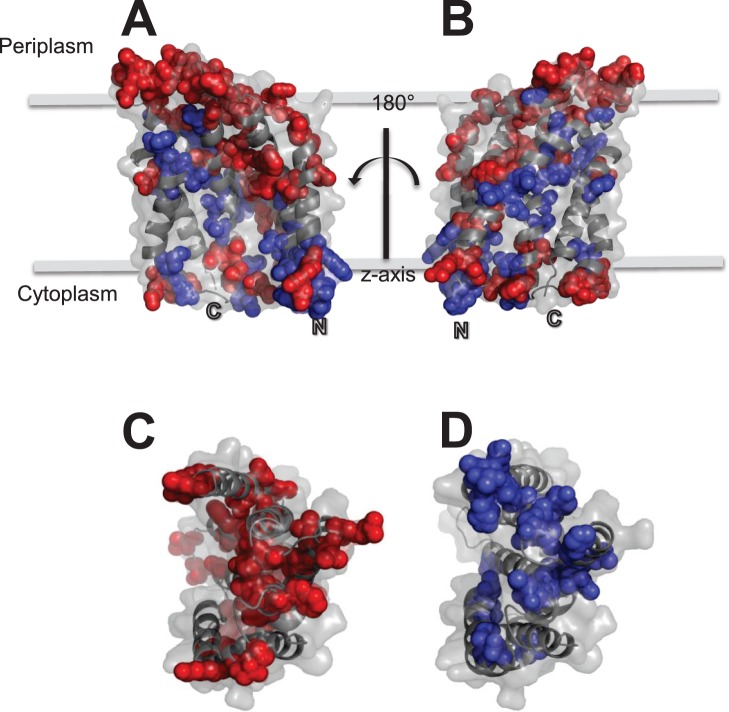
Figure 6. A structural model of E. coli TatC.
In all panels, E. coli TatC proteins are shown as cartoon diagram where secondary structure ribbon diagrams are overlaid onto space filled structures (light grey). In all panels, amino acid residues are highlighted according to their conservation, where residues present at greater than 75% identity (blue) or less than 25% identity (red) based on the consensus data provided in Figure 5 are represented as coloured spheres according to their location in the TatC structure. Panels A to B show cartoon ribbon-space filled diagrams of the E. coli TatC protein within the membrane bilayer plane at 180° rotations from each other. Panels C and D show the TatC protein at a 90° rotation along the x-axis from the membrane plane shown in panels A-B, showing the cytoplasmic facing loops of the TatC structure. The models shown in all panels were built using the Aquifex aeolicus TatC structure pdb file (4B4A) [27] as described in the Methods section.

