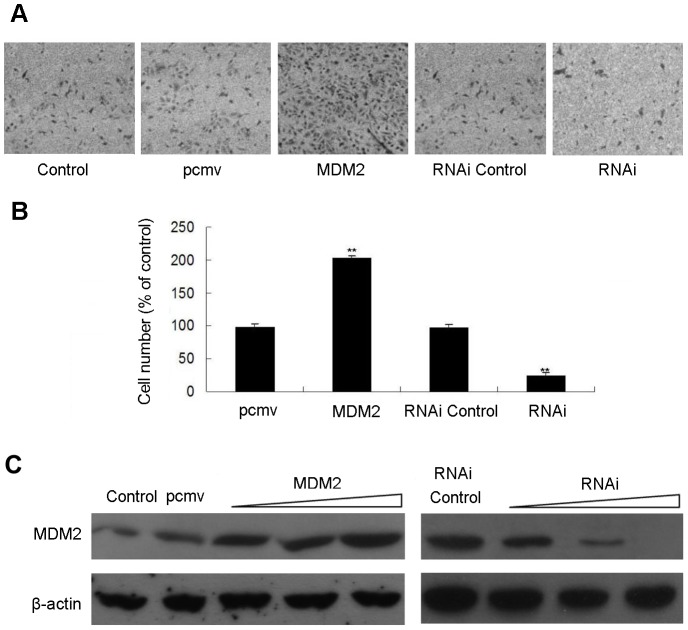
Figure 6. MDM2 promotes the invasion of MDA-MB-231 cells.
MDA-MB-231 cells were transfected with pcmv-MDM2 expression plasmids and pcmv vectors, siRNAs against MDM2 or non-specific siRNA (controls). After 48 h, the cells were plated onto a Matrigel to assay cell invasion. Cells were allowed to migrate for 20 h at 37°C. Cells on the upper side of the inserts were removed with a cotton swab. Cells that migrated to the lower side of the filters were stained with 1% crystal violet and counted under light microscopy. (A) Digital pictures of cell invasiveness. Stained areas represent the numbers of invasive cells, and all images are representative of three independent experiments; (B) Number of invasive cells compared to the control (expressed as the percentage of the control). (C) The levels of MDM2 protein were detected using Western blot analysis in MDA-MB-231 cells that over- or under-expressed MDM2 (plasmid or siRNA transfection) and control cells. β-actin levels served as internal control.

