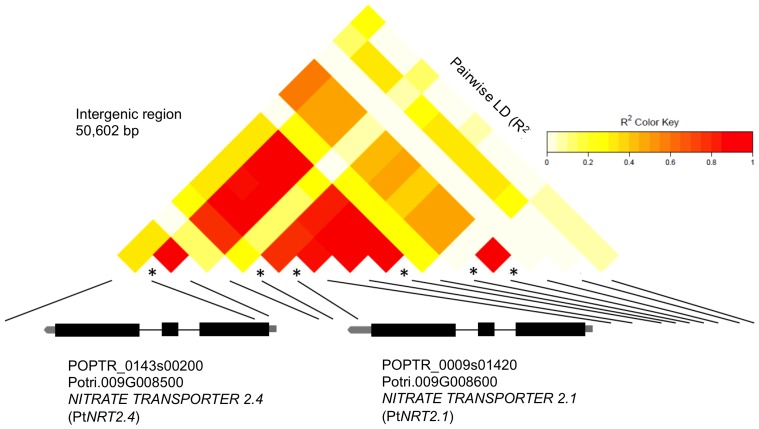
Figure 4. Pairwise linkage disequilibrium plot of NITRATE TRANSPORTER2.1 and NITRATE TRANSPORTER2.4 with gene structures.
SNPs significant are indicated with an asterisk. Scaffold_9_ 1676227 in the intergenic region had the highest significance (P = 3.52×10⁻⁷) and largest effect on AUDPC in 2010 (R2 = 0.034). Scaffold_143_2955 was annotated to Potri.009G008500 in JGI Populus trichocarpa genome v3.

