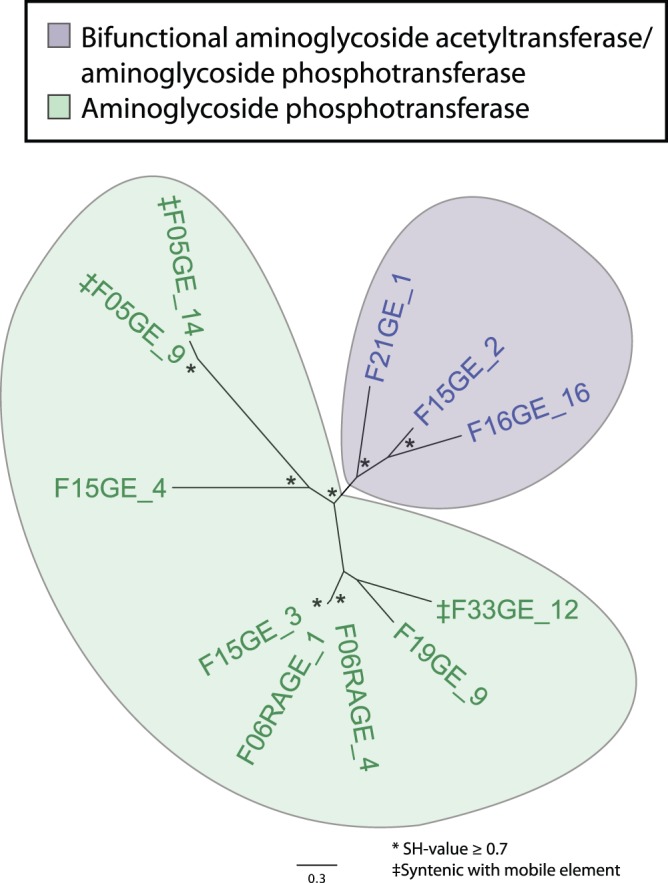
Figure 3. Unrooted approximate maximum-likelihood phylogenetic tree constructed using the predicted amino acid sequences of all aminoglycoside aminotransferases and phosphotransferases in the study set.

Enzyme classes are color-coded as indicated in the legend. At the terminus of each branch, the name of the source contig is listed. Aminoglycoside phosphotransferases that were syntenic with aminoglycoside acetyltransferases are indicated with purple bold text and marked with a ‡. Genes syntenic with a mobile element are bolded and marked with a §. Nodes with a Shimodaira-Hasegawa (SH)-value > = 0.7 are starred.
