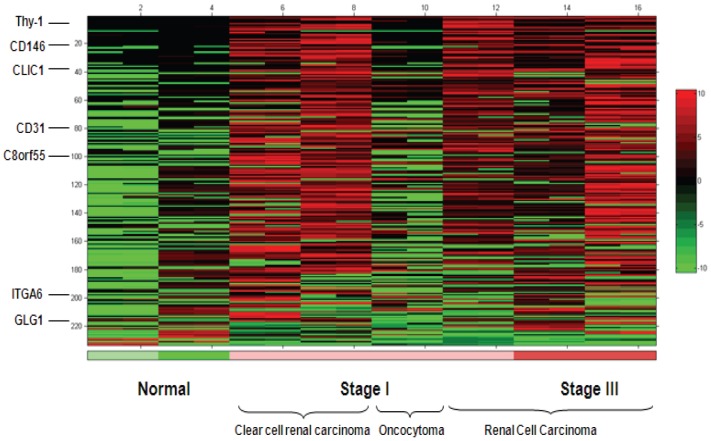
Figure 4. Global peptide analysis identified over-expressed proteins in kidney tumor tissue endothelium.
The heat map presents the analysis of peptide intensities for the 233 peptides identified in kidney tumor endothelium and sorted so that the most differentially-expressed peptides are at the top. The display colors were determined for each row separately by assigning black to the median intensity in the row, green to the lowest intensity in the row, and red to the highest intensity.

