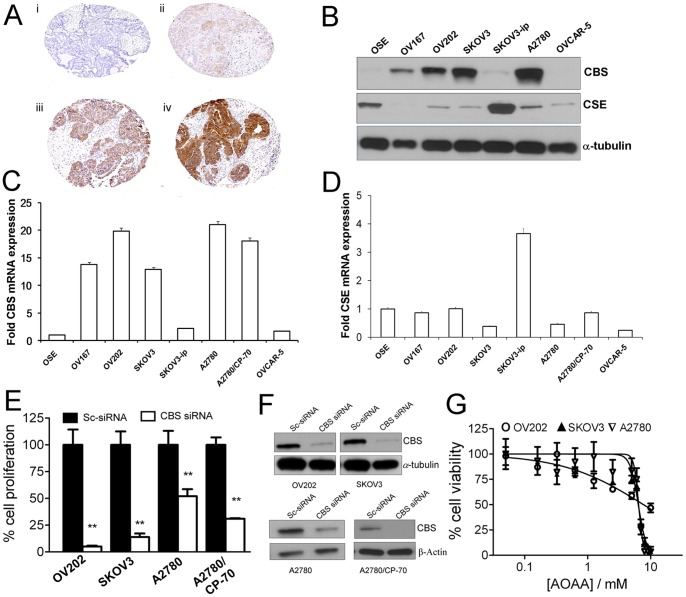
Figure 1. Expression and phenotypic effects of CBS in vitro.
(A) Immunohistochemical staining of a tissue microarray of epithelial ovarian cancer samples. Representative images are shown of none (i), weak (ii), moderate (iii), and (iv) strong staining. (B) Expression of CBS and CSE in various ovarian cell lines as determined by immunoblotting. α-tubulin is used as the loading control. (C) RT-PCR data showing the expression of CBS mRNA in various ovarian cell lines. (D) RT-PCR data showing the expression of CSE mRNA in various ovarian cell lines. (E) Effect of CBS knockdown on the proliferation of OV202, SKOV3, A2780 and A2780/CP-70 cells and (F) Immunoblotting data to determine the extent of siRNA-mediated knockdown. (G) Effect of CBS inhibition on the proliferation of OV202, SKOV3 and A2780 cells by AOAA (24 h treatment) determined through MTS assay.

