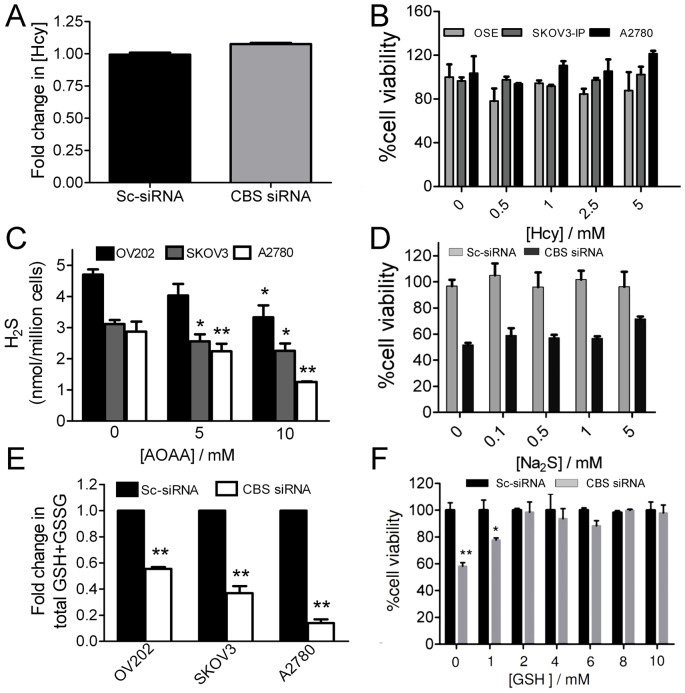
Figure 2. Effect of CBS knockdown on metabolite levels.
(A) Change in Hcy levels in the cell lysates of Sc-siRNA and CBS siRNA treated A2780 cells measured by mass spectrometry. (B) Hcy overdose experiment to demonstrate the effect of Hcy (24 h treatment) on the proliferation of OSE, A2780 and SKOV3-ip cells by MTS assay. (C) H2S levels in OV202, SKOV3 and A2780 cells after chronic inhibition with different doses of AOAA for 3 h. (D) Na2S rescue experiment after knockdown of CBS in A2780 cells. The cells were treated with different doses of Na2S for 24 h and the cell viability was determined by MTS assay. (E) Change in total glutathione level 48 h post-transfection with scrambled control and CBS siRNA in OV202, SKOV3 and A2780 cells. (F) GSH rescue experiment after knockdown of CBS in A2780 cells. The cells were treated with various doses of GSH for 24 h and the cell viability was assessed by MTS assay.

