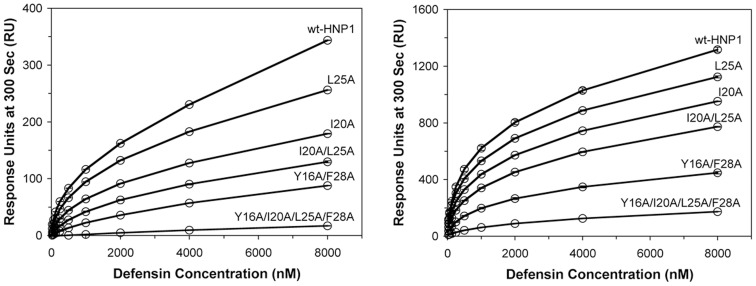
Figure 7. Surface plasmon resonance binding curves.
Binding of HNP1 and mutants to 233 RU of HNP1 (left) and binding of HNP1 and mutants to 2770 RU of gp120 (right). The curves are plots of RU values at 300 s of association versus different defensin concentrations (from 0 nm to 8 µm). The RU values are the average readings from three measurements.

