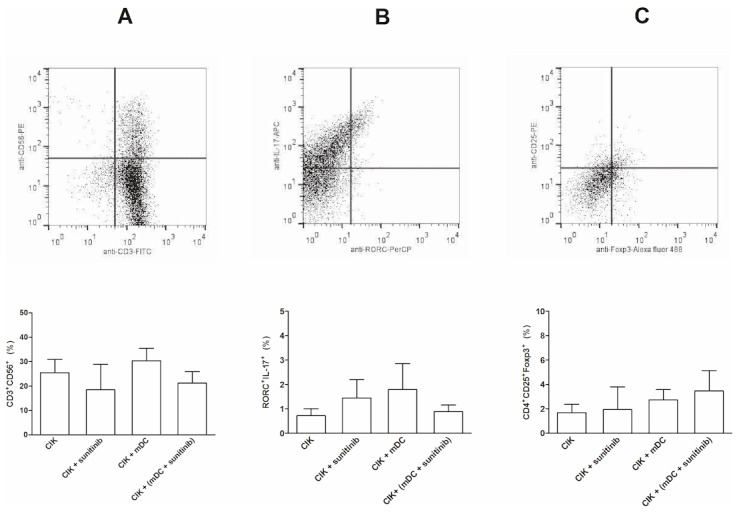
Figure 4. The FACS analysis for the alteration in the proportion of subpopulations in CIK cells.

The studied subpopulations included CD3+CD56+(A), Th17 (RORC+IL-17+, B) and Treg (CD4+CD25+Foxp3+, C) subsets. The corresponding dot plot analysis demonstrated the gating of each subset. The CIK cells were either exposed to sunitinib directly, primed with mDCs or primed with sunitinib-pretreated DCs.
