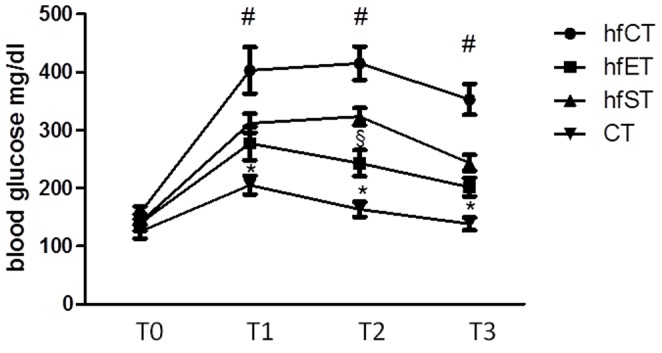
Figure 7. Blood glucose levels after at T0before (T0), 30 min after (T1), 60 min after (T2), and 2 h after (T3) intraperitoneal application of 2 g glucose.

# indicates significant differences of hfCT to all other groups, * indicates significant differences of CT to all other groups, § indicates significant differences to ET group (p<0.05).
