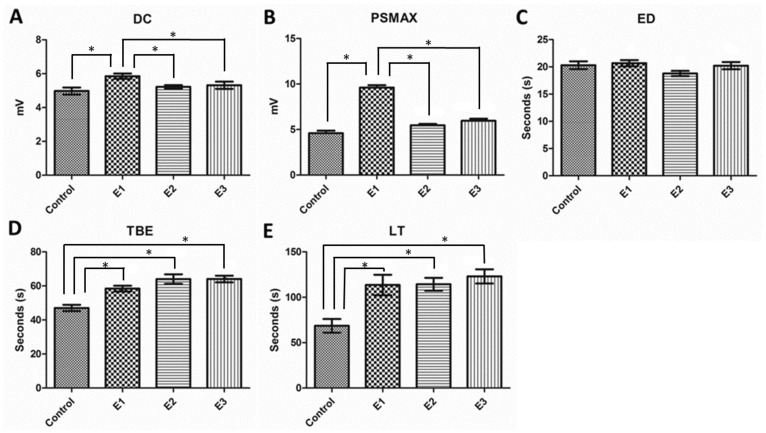
Figure 2. Parameter analysis of the extracellular potential recorded for non-synaptic epileptiform activities.
Statistical comparisons were done with one-way ANOVA with Dunnett’s test. A: Average amplitude of DC shift during burst activity. E1 group showed the highest value, while control, E2 and E3 did not differ statistically. B: Maximum population spike (PS). E1 showed the highest value, while control, E2 and E3 did not differ statistically. C: Events durations (ED). No difference was found between all groups. D: Time between events (TBE). Control exhibited the lowest value, while E1, E2 and E3 did not differ statistically. E: Latency (LT) to the onset of the non-synaptic activities. Control exhibited the lowest value, while E1, E2 and E3 did not differ statistically. Data are presented as mean ± SEM. Error bars indicate SEM. * p<0.05.

