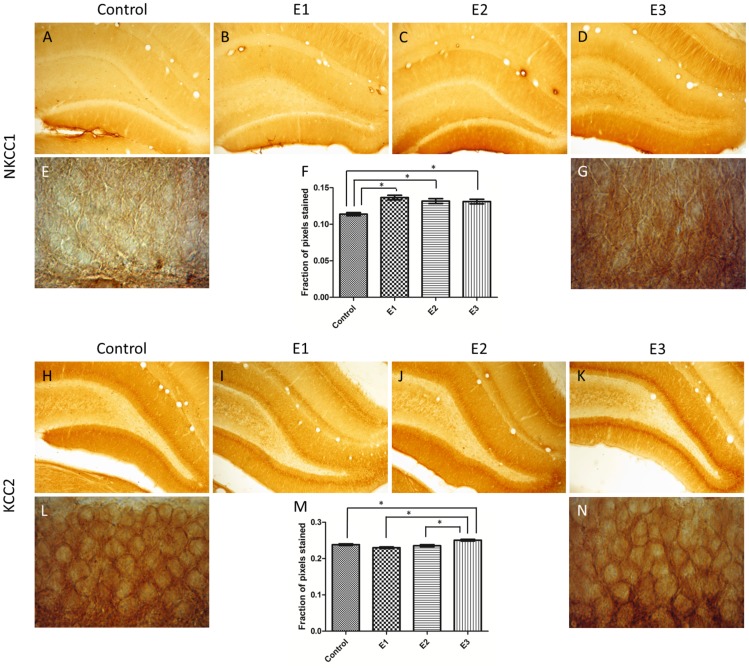
Figure 4. DG immuno-stained for NKCC1 and KCC2.
Typical images for NKCC1 (Magnification: 400x). All alcohol treated groups expressed more intense staining for NKCC1 than Control (A). For KCC2 the immuno-reactivity was more intense for the group E3 (K) (Magnification: 1000x). The transition between the granule and molecular layers exhibited the most intense staining for both NKCC1, comparing E3 (G) with Control (E), and KCC2, comparing E3 (N) with Control (L). Statistical comparisons were done with one-way ANOVA with Dunnett’s test. Data are presented as mean ± SEM. Error bars indicate SEM. *p<0.05.

