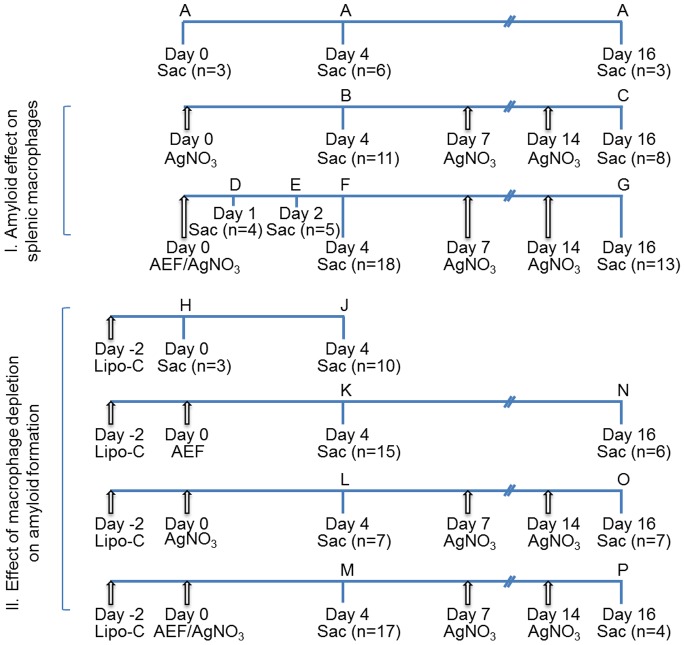
Figure 1. The cartoon outlines animal groups, treatment and time schedules used for the two studies.
In section I, is ¨Effect of amyloid on splenic macrophages¨ described, and in II, is ¨Effect of macrophage depletion on amyloid formation¨ described. Capital letter indicates experimental group, arrows indicate time points for injections, Sac indicate time points when mice were sacrificed, and n specifies number of mice.

