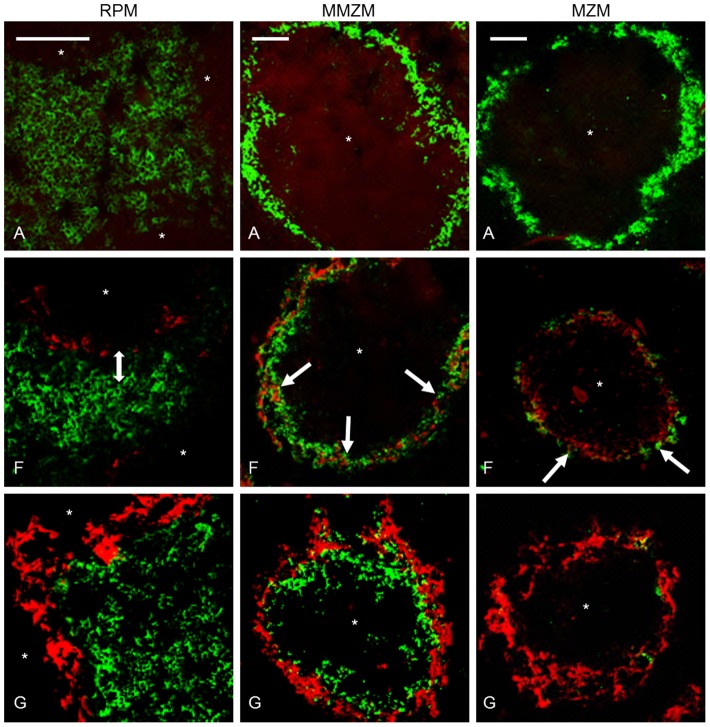
Figure 2. Amyloid deposition was accompanied by changes of splenic macrophages.
Group A untreated control, group F received AEF and AgNO3 day 0 and was sacrificed day 4, group G received AEF and AgNO3 day 0, additional injections of AgNO3 on day 7 and 14, and was sacrificed day 16. In the left panel, a double arrow indicates a distance between RPMs and amyloid in group F, which does not persist in group G. The middle panel depicts MMZMs intermingling with amyloid in groups F (white arrow) and G. In the right panel, arrow indicates an onset loss of MZMs in group F, and complete loss of MZMs in marginal zones with extensive amyloid deposits in group G. Capital letter refers to experimental group, amyloid in red, macrophages in green,* indicate white pulp region, and bar = 100 µm.

