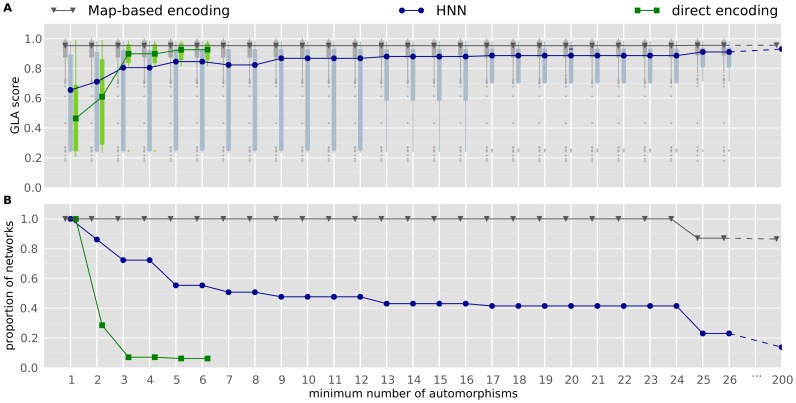
Figure 6. Relationship between regularity and general learning abilities.
Data are from the same experiments as Figure 4. The “minimum number of automorphims” means that if, for example, a network has 4 automorphisms, it is included in columns 1,2,3 and 4. X-values are shifted for the map-based encoding and the direct encoding in order to make the figure readable. A. The more automorphisms a network has, the more likely it is to have good general learning abilities (GLA score). Each box extends from the lower to upper quartile values of the data, with a symbol at the median. Whiskers extend to the most extreme data point within  , where IQR is the interquartile range. Flier points (outliers) are those past the end of the whiskers. B. 7% of networks evolved with a direct encoding have more than 3 autormorphisms.
  of those evolved with HNN have more than 3 automorphisms.
  of networks evolved with the map-based encoding have more than
  autmorphisms; 100% of them have at least 10 automorphisms.

