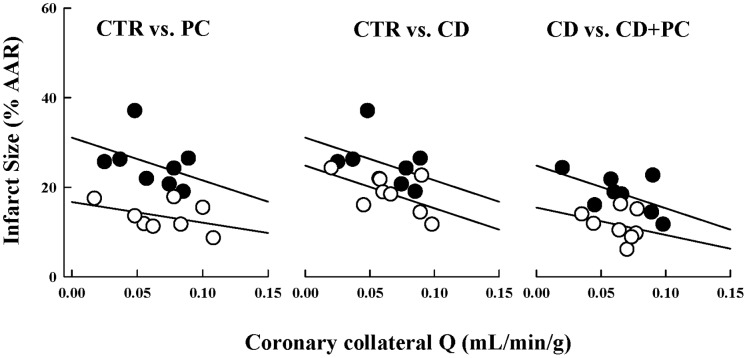
Figure 4. Infarct size (% AR) versus coronary collateral blood flow (mL/min/g).
Left panel: CTR (closed symbols; y = 32.4−112.6X, r2 = 0.203) versus PC (open symbols; y = 11.6−32.9X, r2 = 0.055) dogs. Middle panel: CTR (closed symbols; y = 32.4−112.6X, r2 = 0.203) versus CD (open symbols; y = 24.9−96.4X, r2 = 0.327). Right panel: CD (closed symbols; y = 24.9−96.4X, r2 = 0.327) versus CD+PC (open symbols; y = 15.5−60.7X, r2 = 0.079) dogs. The downward shift of the regression indicates significant protection that occurs independently of changes in coronary collateral blood flow. Each point represents an individual dog.

