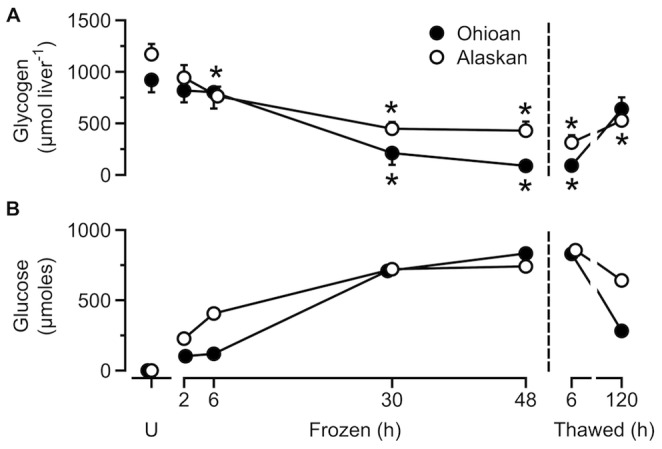
Figure 2. Hepatic glycemic response during freezing and thawing.

Liver glycogen content (A) and glucose output (B) during freezing and thawing in Alaskan and Ohioan R. sylvatica as compared to that in unfrozen frogs (U) (mean ± SEM; N = 4–8). Glucose output (B) was calculated by subtracting the mean liver glycogen content (µmol liver −1) remaining at each sample from the mean liver glycogen content of unfrozen frogs. Asterisk indicates that the value differs from the mean for the corresponding sample of unfrozen frogs (Dunnett’s, P<0.05). Some overlapping values were slightly offset along the abscissa for clarity.
