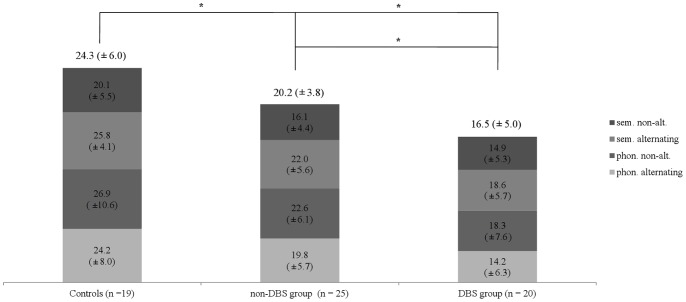
Figure 1. Verbal Fluency Task.
The total number of words uttered by controls and both patient groups (each ON therapy) subdivided into the four task conditions; respective group average values are given on top of each column. Both patient groups produced significantly less words than controls. DBS patients uttered significantly less words than non-DBs patients. Values indicate the mean (± standard deviation), asterisks indicate statistically significant differnces (*: p<.05/**: p<.01). sem.: semantic; phon.: phonemic; alt.: alternating.

