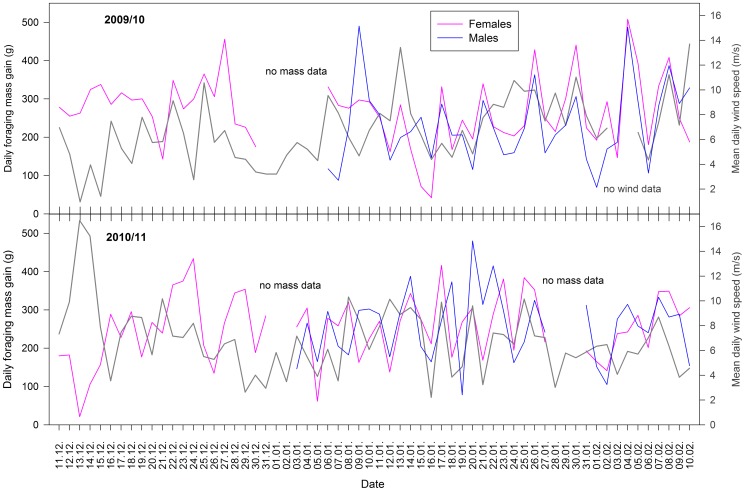
Figure 1. Daily foraging mass gain with wind speed across time.
Daily foraging mass gain (in g) of females (in pink) and males (in blue) against wind speed (in dark grey) in the breeding seasons 2009/10 (top) and 2010/11 (below). Daily foraging mass gain was calculated as the difference between mean mass of adults leaving the colony in the mornings and mean mass of adults returning to the colony in the evenings.

