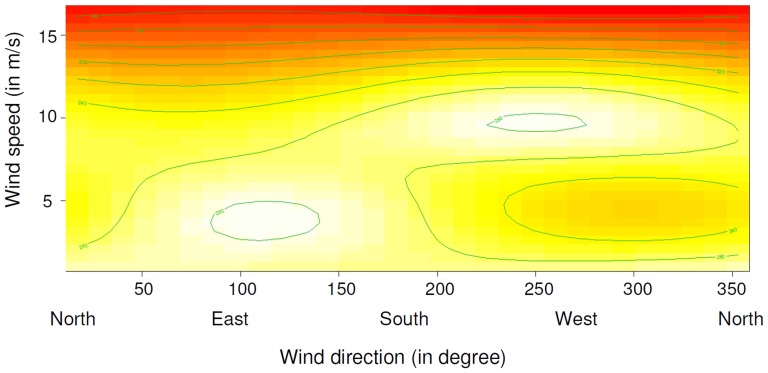
Figure 3. Relationship between daily wind speed and daily wind direction on the daily foraging mass gain of southern rockhopper penguins.
The graphical output of the GAM (see Table 2 for details) shows foraging mass gain as a colour scale ranging from high foraging success in white to low foraging success in red, depending on wind speed (y-axis) and wind direction (x-axis).

