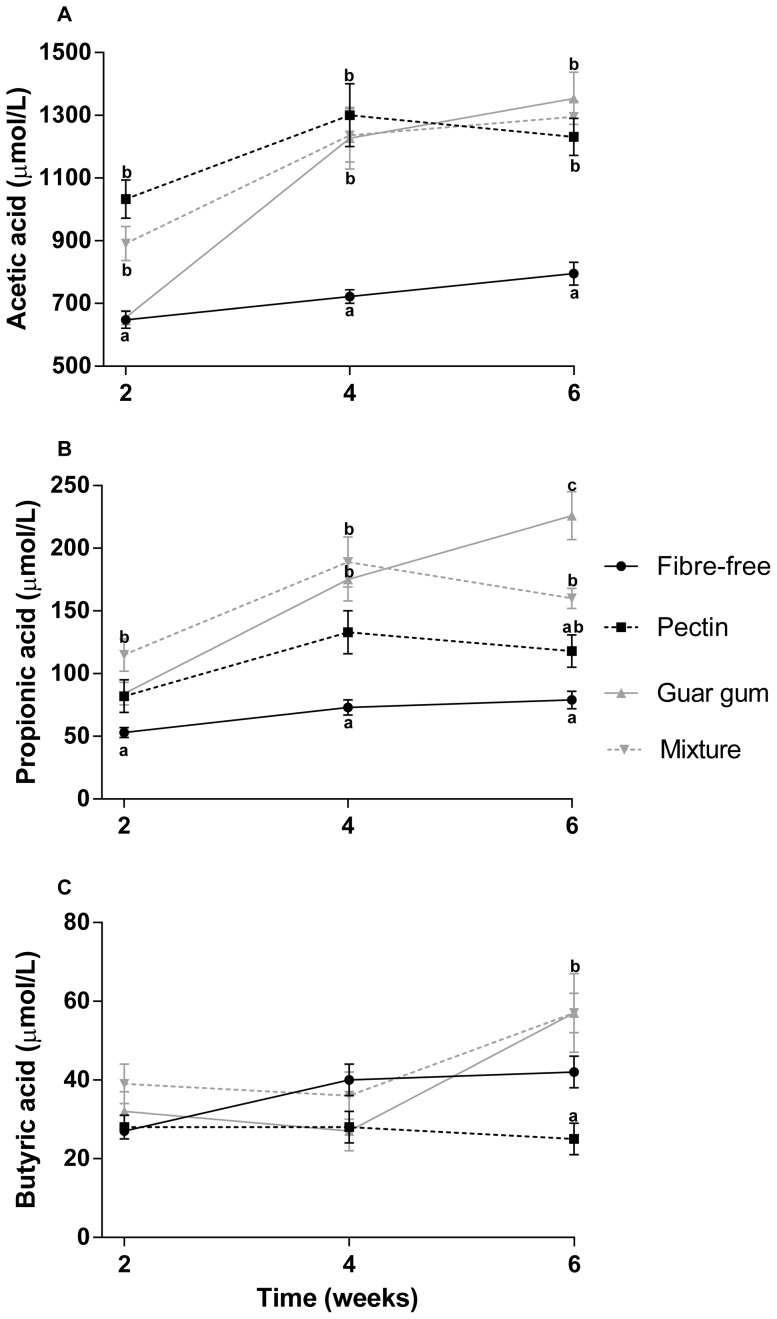
Figure 5. Serum concentration of SCFAs.
Serum concentration (µmol/L) of A: acetic acid, B: propionic acid and C: butyric acid in rats fed the four HFD for 2, 4 and 6 weeks (means ± SEM, n = 7, with exception of groups pectin and fibre-free diets for 4 and 6 weeks, respectively, n = 6). Values with different letters are significantly different, p<0.05.

