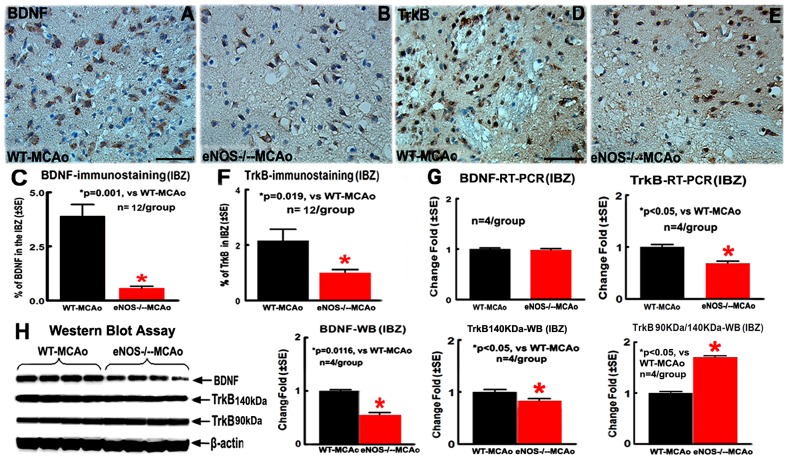
Figure 5. eNOS-/- mice show significantly decreased BDNF and TrkB expression in the ischemic brain.
A-C: BDNF-immunostaining and quantitative data in the IBZ; D-F: TrkB-immunostaining and quantitative data in the IBZ; G: Quantitative data of BDNF/TrkB-mRNA expression in the IBZ. H: BDNF, 140 KDa and 90 KDa of TrkB protein expression in the IBZ measured by Western blot and quantitative data; Scale bar in A = 50 µm; *p<0.05, n = 12/group in A–F, n = 4/group in G and H.

