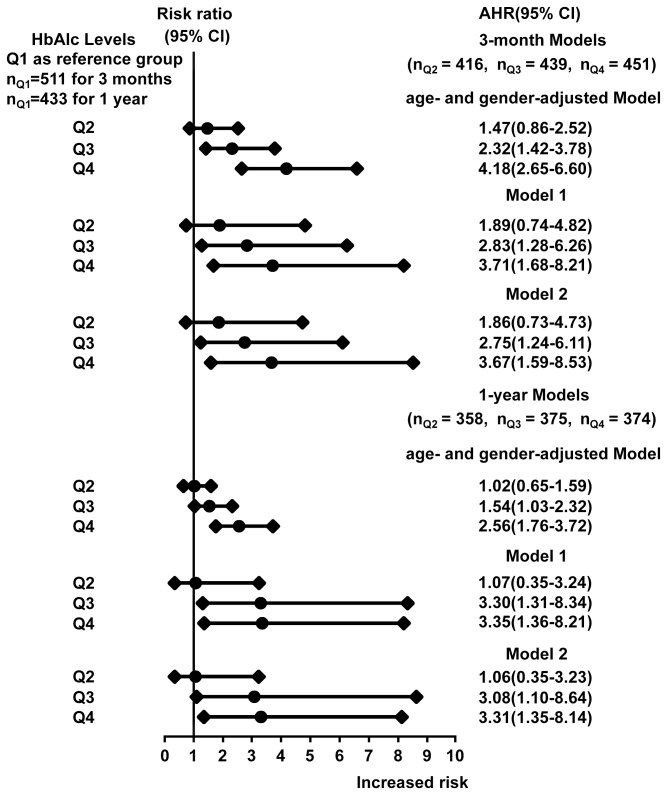
Figure 3. Association between HbA1cl levels and Stroke Recurrence.
Q1 (reference group), HbA1c level of <5.5%; Q2, HbA1c level of 5.5 to <6.1%; Q3, HbA1c level of 6.1 to <7.2%; Q4, HbA1c level of ≥7.2%.
AHR indicates adjusted hazard ratio; CI indicates confidence interval; HOMA2-IR indicates the correctly solved computer model for homeostasis model assessment of insulin resistance; TOAST, the Trial of ORG 10172 in Acute Stroke Treatment; OCSP, the Oxfordshire Community Stroke Project.
3-month Model 1 adjusted for age, gender, education status received, tabacco use, alcohol consumption, systolic and diastolic pressure at baseline and discharge, BMI and waist circumference, a history of coronary heart disease, a history of hypertension and a history of family stroke, a history of diabetes, ischemic stroke subtypes, OCSP subtypes, HOMA, uric acid, homocysteine, creatinine, high density lipid protein, low density lipoprotein, triglyceride and cholesterol, medication therapy (antithrombotic, antihypertensive and lipid-lowering medications) during hospitalization, and medication adherence (antithrombotic, antihypertensive and lipid-lowering medications) at 3-month follow-up.
3-month Model 2 adjusted for all the variables in 3-month Model 1 plus fasting plasma glucose.
1-year Model 1 adjusted for all the variables in 3-month Model 1 (except 3-month medication adherence) plus medication adherence at 1-year follow up including anti-hypertensive agent, lipid-lowering agent and anti-thrombotic agent.
1-year Model 2 adjusted for all the variables in 1-year Model 1 plus fasting plasma glucose.

