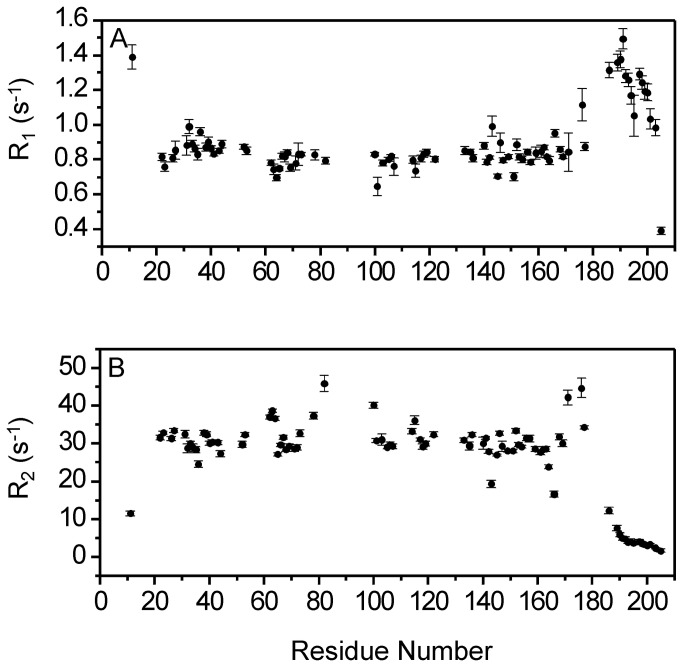
Figure 3. GCAP1 forms a dimer in solution.
15N NMR relaxation data are shown for EF4mut. Spin-lattice relaxation rate constants (A) and spin-spin relaxation rate constants (B) are plotted as a function of residue number. All data were measured at 60.81 MHz 15N frequency and 37 °C. (C) Size-exclusion chromatography (SEC) elution profiles are shown for GCAP1 wildtype (solid line) and V77E (dotted line). The protein concentration was 200 μM for the samples analyzed by SEC.

