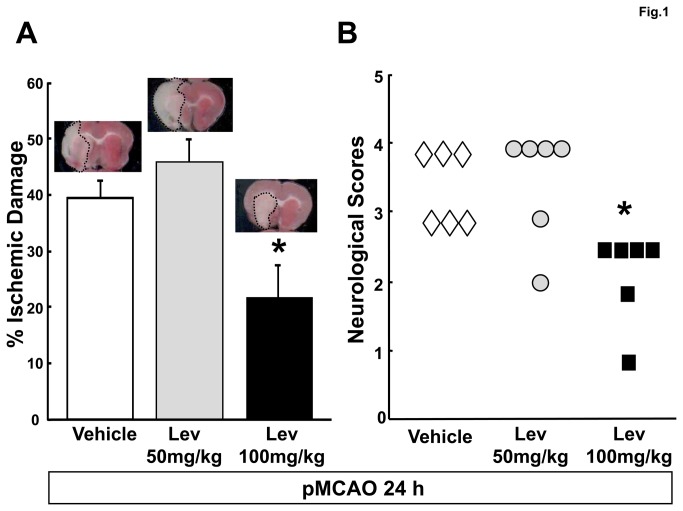
Figure 1. Levetiracetam reduces the ischemic brain damage evaluated 24 hours after pMCAO.
A, percent ischemic damage in vehicle- and Lev-treated ischemic rats. The bar graph reports the mean+SEM of the volume of the ischemic lesion normalized to the volume of the entire hemisphere ipsilateral to vessel occlusion. See the methods section for more details. The microphotographs on the top of the bars show representative TTC-stained brain slices obtained 24 after pMCAO from rats belonging to the respective experimental groups. Note that the ischemic area is smaller in the animal receiving the highest dose of Lev than in the other two rats.
B, neurological deficits in vehicle and Lev-treated ischemic rats, evaluated 24 hours after pMCAO. The scatter graph shows the individual data of the Clark’s score for generalized neurological deficits in rats receiving vehicle, 50mg/kg or 100 mg/kg Lev as indicated. *, p<0.05 vs vehicle (n=6 in all groups).

