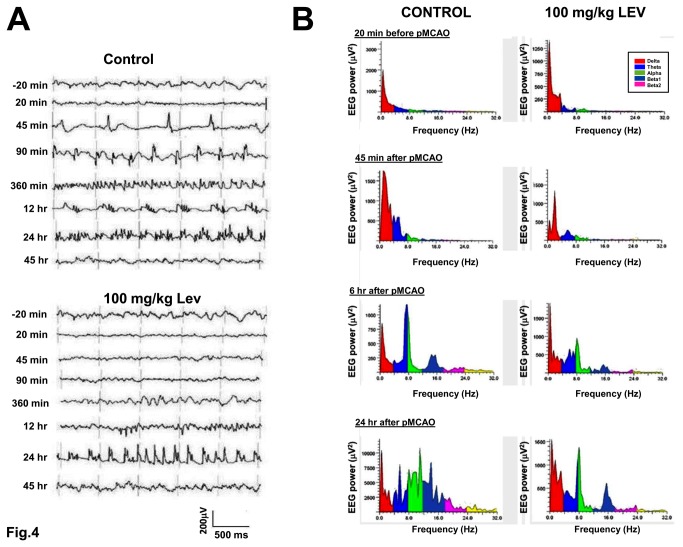
Figure 4. Time course and electrophysiological characteristics of the non-convulsive seizures in control rats and in rats treated with Levetiracetam.
A, examples of the different types of EEG activity recorded at different times after pMCAO in a control (top) and in a Lev-treated (bottom) rat. Note the different time course of NCSs in the control and in the Lev-treated rat. In the control rat, spike-wave activity predominated 45 and 90 min after pMCAO, polyspike-waves after 12 hours and polyspikes after 24 hours. In the Lev-treated rat, NCSs appeared only 12 hour after pMCAO in the form of polyspike complexes. B, Spectral graph analysis of the EEG traces obtained at different times from pMCAO in a control rat (top) and in a rat injected with 100mg/kg Lev. The graphs show the frequency distribution of the power of the EEG signal in the frequency range from 0.25 up to 32 Hz. The main band components of the EEG signal, delta, theta, alpha, beta 1, beta 2, are shown in different colors as detailed in the insets. Each spectral graph was obtained by the analysis of 10 sec of artifact-free recordings. Note that, both in the control and in the Lev-treated rat, the appearance of NCSs corresponded to a strong increase of the power in the regions of high theta and low alpha bands.

