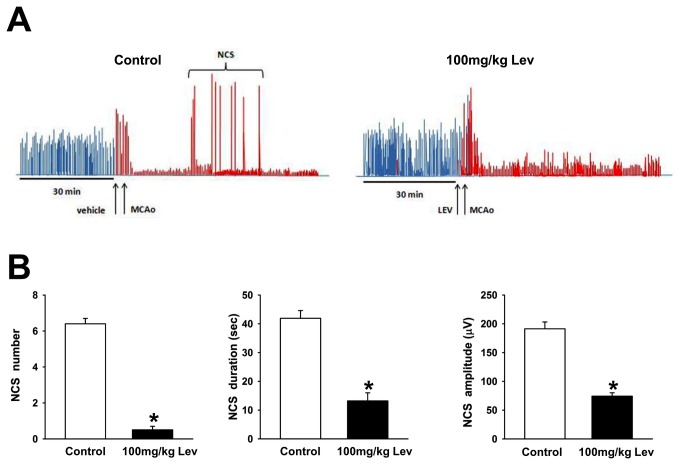
Figure 5. Levetiracetam prevents the occurrence of non convulsive seizures.
A, representative spectral trend graphs showing the changes in total EEG power after pMCAO in a control (left) and in a Lev-treated (right) rat. Each bar represents the total power (in μV2) calculated by integration of the power spectrum of the EEG recorded during about 120 min interval. The bars colored in red denote the data obtained during the first 90 min of recordings after pMCAO. Note the dramatic drop in total EEG power after pMCAO induction both in the presence and in the absence of Lev. The sudden and transient increases in EEG power correspond to the NCS activity that appears in the control but not in the Lev-treated rat. B, Number, duration and amplitude of NCSs in Lev treated and in control animals. The bar graphs show from the left to the right the mean+SEM of the number, duration in sec and amplitude in μV of the NCS observed during the first 2 hours after pMCAO in control (n=7) and Lev-treated (100mg/kg; n=7) rats. * p<0.05.

