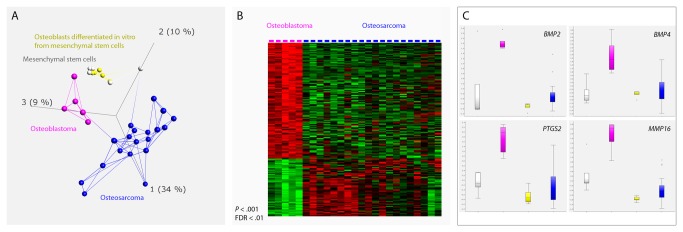
Figure 2. Gene expression signature of osteoblastoma.

(A) Unsupervised principal component analysis based on the expression of the 1297 most variable genes (σ/σmax = 0.3) shows that the five osteoblastomas form a group that has an expression profile separate from the osteosarcomas, mesenchymal stem cells, and osteoblasts differentiated in vitro from mesenchymal stem cells. The first three principal components, representing 34%, 10%, and 9% of the variance, are displayed. Lines connect the three nearest neighbors. By subsequently comparing osteoblastoma and osteosarcoma, 140 genes showed a significantly different expression (p < 0.001, FDR < 0.01; Tables S2 and S3). (B) The differentially expressed genes are displayed in a heat map. Genes with high and low expression values are labeled in red and green, respectively. (C) Many of the highly expressed genes in osteoblastoma are known to be involved in bone metabolism and at least four of them are induced by the Wnt/beta-catenin signaling pathway; BMP2, BMP4, PTGS2 and MMP16. Boxes range from the 25th to the 75th percentile. The box whiskers are set at the lowest data point value still within 1.5 times the box range of the lower box limit, and at the highest data point value still within 1.5 times the box range of the upper box limit. The median is displayed as a dotted band. Outliers are defined as data point values falling outside of the box whisker limits.
