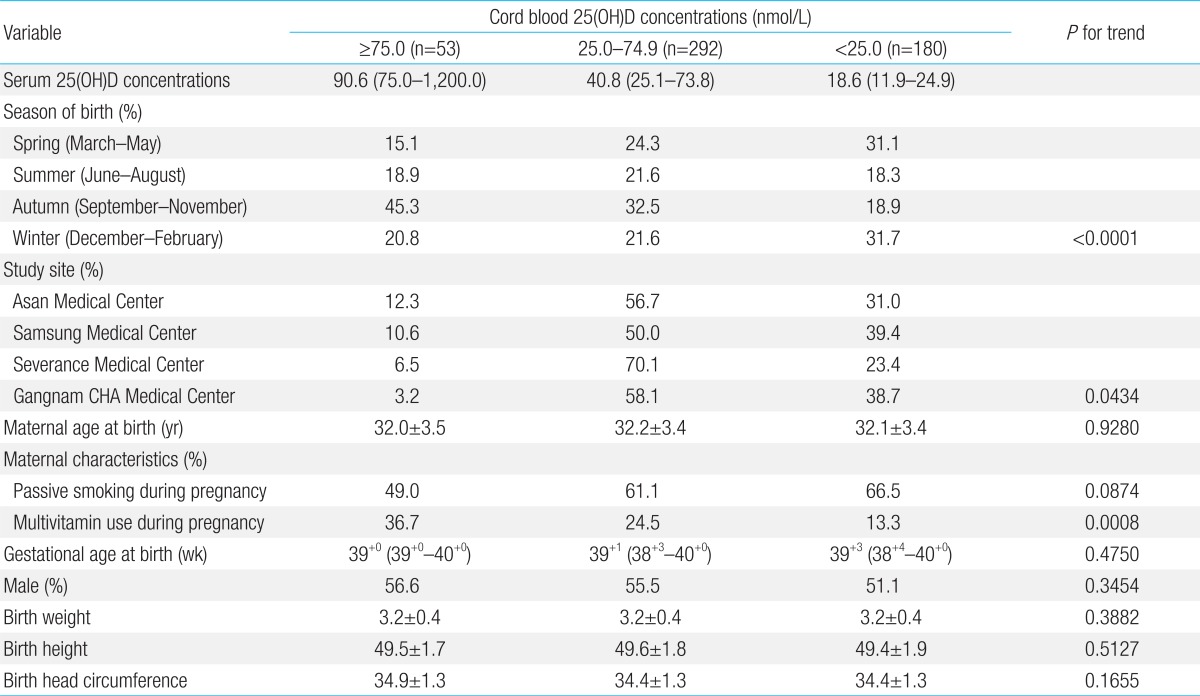
Table 2.
Potential confounders according to cord blood levels of 25(OH)D

Values are presented as median (range), number (%), or mean±standard deviation. P-values for trends were determined using the Chi-square test (for passive smoking and multivitamin use) and by linear regression analysis (season of birth) using dummy variables. 25(OH)D, 25-hydroxyvitamin D.
