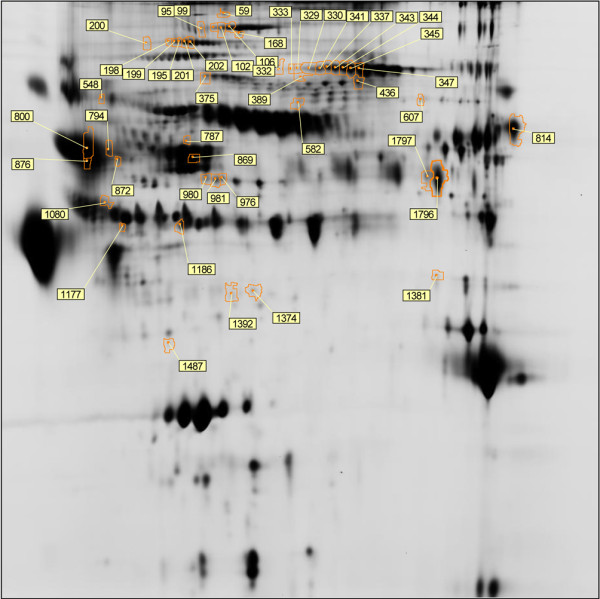
Figure 1.

Differential expression analysis. A total of 52 unique protein spots with greater than 1.2 fold change and p-value < 0.05. Each spot boundary is defined in orange and labeled with assigned spot number. Differential spots were excised from the gel and identified via mass spectrometry.
