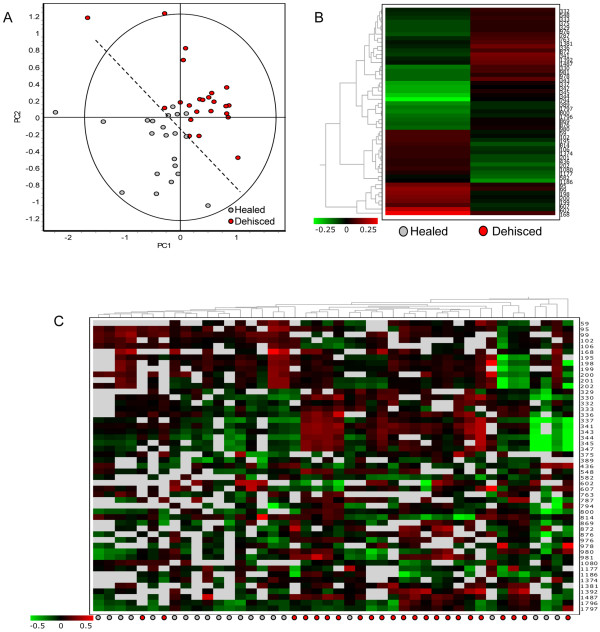
Figure 2.
DeCyder cluster analysis. Fifty two verified differential expression protein spots (t-test > 0.5, fold change > 1.2) were used for the following analyses using DeCyder Extended Data Analysis. (A) Principle component analysis shows good separation between healed and dehisced samples; each dot represents an individual gel spot map. (B) Hierarchical clustering using the average abundance of differential spots for each experimental group, experimental groups are displayed in columns and protein spots by row, differential expression is displayed by color (red being up-regulated and green being down-regulated relative to the pooled standard. Clusters of differential proteins showing similar expression patterns are further defined in Figure 4. (C) Hierarchical clustering of 44 spot maps according to the 52 differential protein spots, individual patient spot maps are displayed by column and protein spots by rows.

