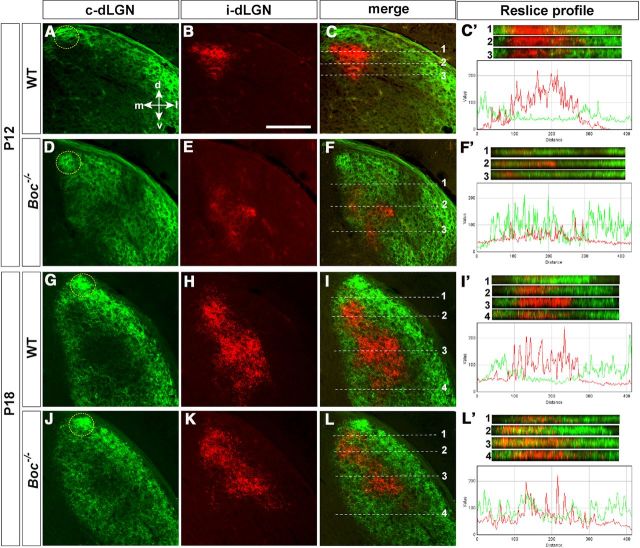
Figure 6.
Organization of the retino-geniculate projections in postnatal Boc−/− mice. Confocal analysis of frontal sections through the dLGN of P12 and P18 WT and Boc−/− mice (as indicated in the panels) after whole-eye anterograde tracing with green and red fluorescent dyes. C′, F′, I′, L′, Reslice profiles taken at the levels indicated in C, F, I, and L, respectively. The accompanying graphs represent the spectra of red (ipsilateral) and green (contralateral) channels of reslice 2 (C′,F′) and reslice 3 (I′,L′), respectively. In WT, the ipsilateral projection (red) is clustered in the dorsocentral dLGN surrounded by contralateral terminations (green). In Boc−/−, ipsilateral fibers are reduced in this region. There is increased clustering of fiber in the dorsomedial tip (area circled with dotted lines) of dLGN where late-born cRGCs of the VTC project. d, Dorsal; m, medial; l, lateral; v, ventral. Scale bar: A–L, 250 μm.

