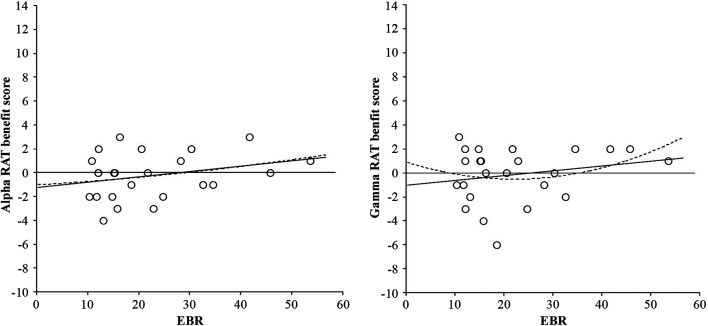
Figure 3.
Linear (solid line) and quadratic (dotted line) relationships between RAT benefit score from alpha frequency binaural beats and EBR (left-hand graph), and RAT benefit score from gamma frequency binaural beats and EBR (right-hand graph). Benefit scores were calculated by subtracting performance in the control condition from performance in the binaural beat condition (either alpha or gamma).

