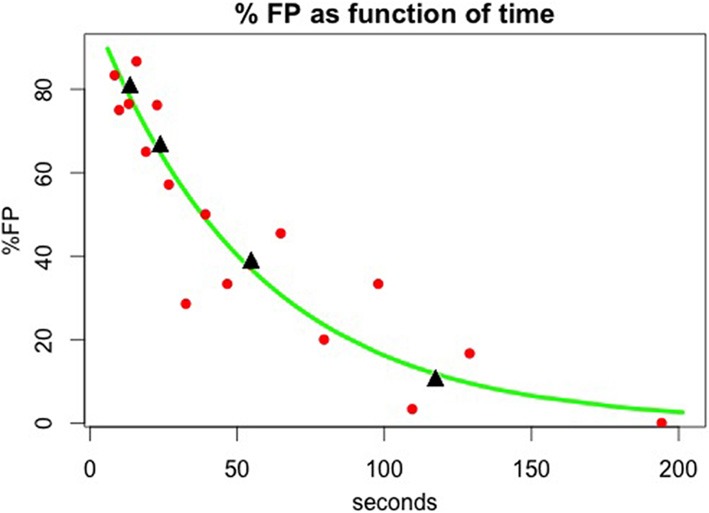
Figure 4.

Memory decay in the case where no reset mechanism has been activated. The raw false positive (FP) and correct rejection (CR) data were fit to time between first image presentation and its repetition using a binomial generalized linear model with logarithmic link function yielding FP = exp (−0.18 * t), (t in seconds) or a decay factor of about 1/3 per min. Red dots correspond to FP rate and time average for data in exponentially increasing time intervals. Black triangles correspond to FP rate and time average over the data in 1, 2, 5, and 10 trials back. Neither of these averages was used for the fitting calculation.
