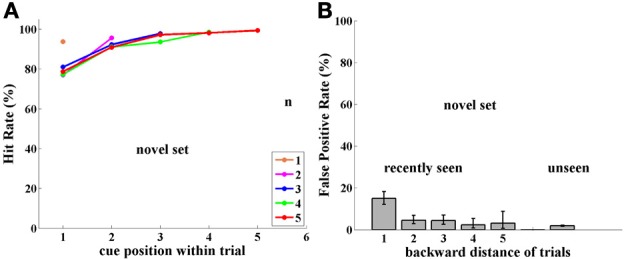
Figure 5.

Experiment II, Group FST, now tested with novel images. (A) Performance (Hit Rate %); note similarity to Figure 3(A) for group NST. (B) FP rate for Group FST with novel images; Note similarity to FPs of same FST group with a fixed image set in Figure 2(B) and, surprisingly, not to the FPs of the NST group with novel images, shown in Figure 3(B).
