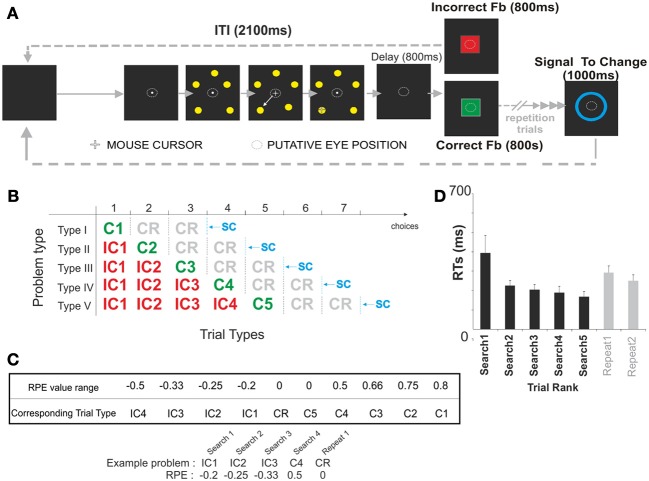
Figure 1.
Behavioral task and performance. (A) Schematic representation of the Problem Solving Task. The goal of the subject was to find by trial and error which one of 5 stimuli was associated with positive feedback. Each trial started with the target presentation. During this period subjects had to chose one stimulus using four computer mouse buttons. Once a target was selected using a computer mouse, the 5 stimuli were switched off. A 800 ms delay followed and preceded the appearance of the feedback. The feedback (a positive feedback was a green square; a negative feedback was a red square) was displayed on the screen during 800 ms and its offset was followed by a 2100 ms inter-trial interval (ITI). After an incorrect choice, subjects continued to search for the correct stimulus while keeping in memory the previous erroneous choices. Discovering the correct stimulus (i.e., associated with green square feedback) ended the search period. The subjects then repeated the correct choice (i.e., repetition period, see shaded area). Immediately after the discovery of the correct target, or after one or two repetition trials, a blue ellipse appeared on the center of the screen 800 ms after the offset of the correct feedback. This ellipse presented for 1000 ms indicated that a new problem would start. (B) Problem types and trials. The problems the subjects were resolving were of five different types (I, II, III, IV, V). Each problem could be decomposed into up to 10 types of trial (IC1, IC2, IC3, IC4, C1, C2, C3, C4, C5, CR). The different trial types were defined based on the obtained feedback and its position within a sequence of feedback obtained during the resolution of one of the 5 types of problems. Feedback obtained at the end of trials were labeled “C” for Correct and “IC” for Incorrect; numbers following “IC” and “C” indicate the rank of the feedback in the search period. For example IC3 indicates that this is the third error of the subject in the search period. C2 indicates a correct feedback obtained after the second choice in the search period. “C” followed by “R” indicates correct trials in repetition periods. The dashed line indicates that the fact that subject is asked to repeat his choice for a variable repetition period of 0 to 2 trials. The vertical blue dashed line represent trials for which SC occurred after two repetition trials. We only represented those trial types on this figure. Vertical black dashed lines illustrate the other putative position of the SC. (C) Reward Prediction Error (RPE) values associated with each trial type. (D) Reaction Times (RTs) measured for the different trial ranks i.e., from 1 to 5 trials in the search period, 1 or 2 trials in the repetition period. All problem types were collapsed for this analysis.

