
Figure 3.
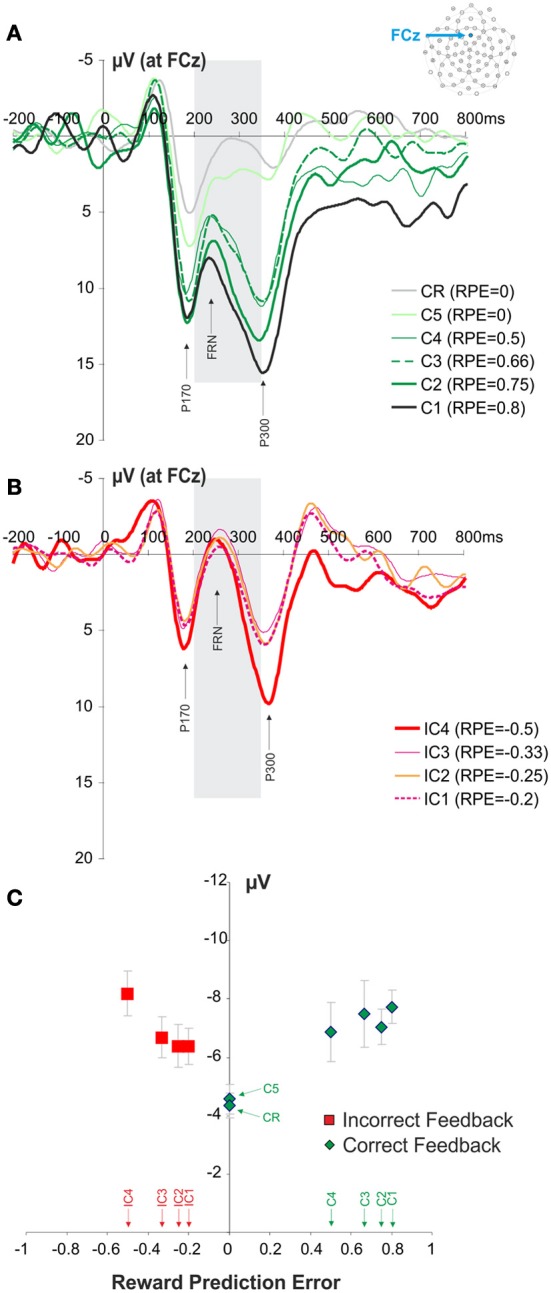
Waveforms recorded at FCz at the presentation of the feedback and FRN modulation. (A,B) Average waveforms elicited by the different correct and incorrect feedbacks. The panel (A) illustrates the signals recorded for the different positive feedbacks (C1, C2, C3, C4, C5, CR). Similarly the panel (B) illustrates the signals recorded for the different negative feedbacks (IC1, IC2, IC3, IC4). The gray box is indicating the time windows of interest in which we measured the amplitude of FRN (+200 to +350 ms post feedback). (C) Modulation of FRN amplitude according to RPE quantified at FCz. Red and green symbols represent RPE values associated with negative and positive feedbacks, respectively. Feedback types corresponding to the different RPE values are indicated above the horizontal axis.