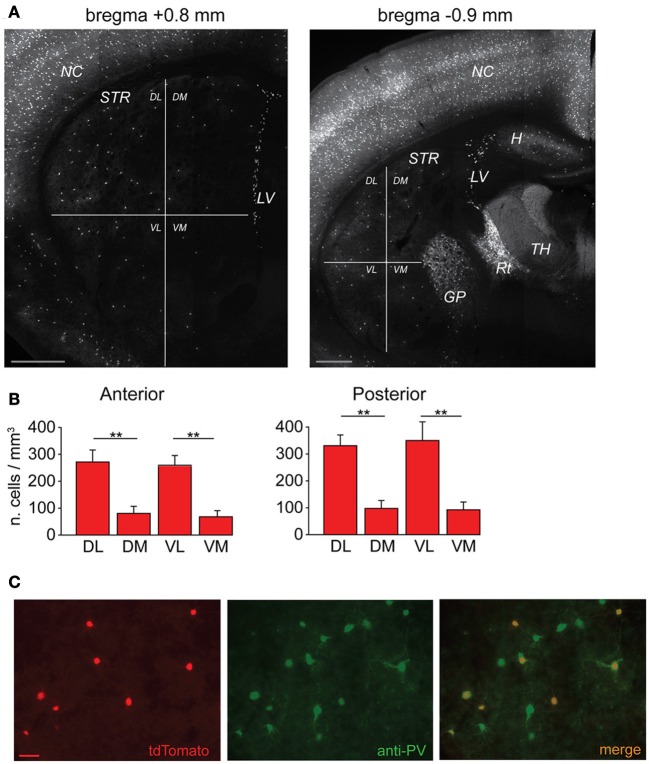
Figure 1.
Anatomical distribution of striatal FSIs and specificity of parvalbumin expression. (A) PV+-tdTomato-labeled FSIs in mouse acute slices. FSIs were prevalently distributed in the dorsolateral (DL) and ventrolateral (VL) sectors of the striatum (STR) as compared to dorsomedial (DM) and ventromedial (VM) quadrants. Examples of anterior (left) and posterior (right) 50 μm-thick striatal sections are shown (+0.8 mm and −0.9 mm from bregma, respectively). Note the greater density of tdTomato labeled cells in other areas such as neocortex (NC), globus pallidus (GP), reticular thalamic nucleus (Rt) and lateral ventricles (LV), and hippocampus (H), while non-reticular thalamic nuclei (TH) contain densely stained fibers but are almost entirely devoid of tdTomato-labeled cell bodies. Scale bars: 500 μm. (B) Quantification of FSI distribution in the striatum. Data refer to average cell densities per slice ± s.e.m. Counts were made in 50 μm thick slices (n = 19) and grouped according to anterior vs. posterior localization of the relative slice with respect to bregma (see Results). Anterior: n = 8 slices, **p < 0.01 paired t-test; posterior: n = 11 slices, **p < 0.01. (C) Comparison between expression of td-Tomato (left) and anti-PV immunostaining (middle) in a sample area of DL striatum. An overlap of the two images (right) shows that all td-Tomato cells were also PV-immunopositive, while roughly 50% of the PV-immunopositive cells did not express tdTomato. Scale bar: 50 μm.

