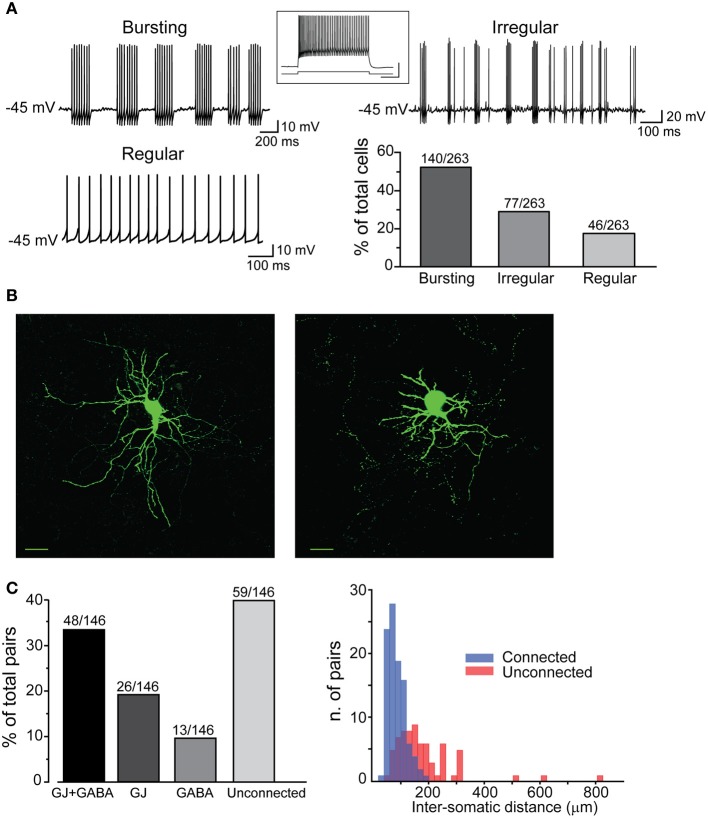
Figure 2.
Electrophysiological properties and connectivity patterns of striatal FSIs. (A) Examples of different firing patterns and relative distributions. Traces are excerpts from 20 to 60 s lasting recordings in which cells were injected with suprathreshold DC (Iinj bursting: 500 pA; regular: 400 pA; irregular: 500 pA). The histogram shows relative distributions of different firing patterns. Inset: high-frequency firing activity in response to supra-threshold current pulse (700 pA, bottom trace). Calibration: 30 mV, 250 ms. (B) Confocal microphotographs showing two different FSIs filled with neurobiotin-488 (scale bars: 20 μm). (C) Left, rates of different connectivity patterns between pairs of striatal FSIs. Right, spatial distribution of connected and unconnected FSI pairs relative to the distance between cell bodies.

