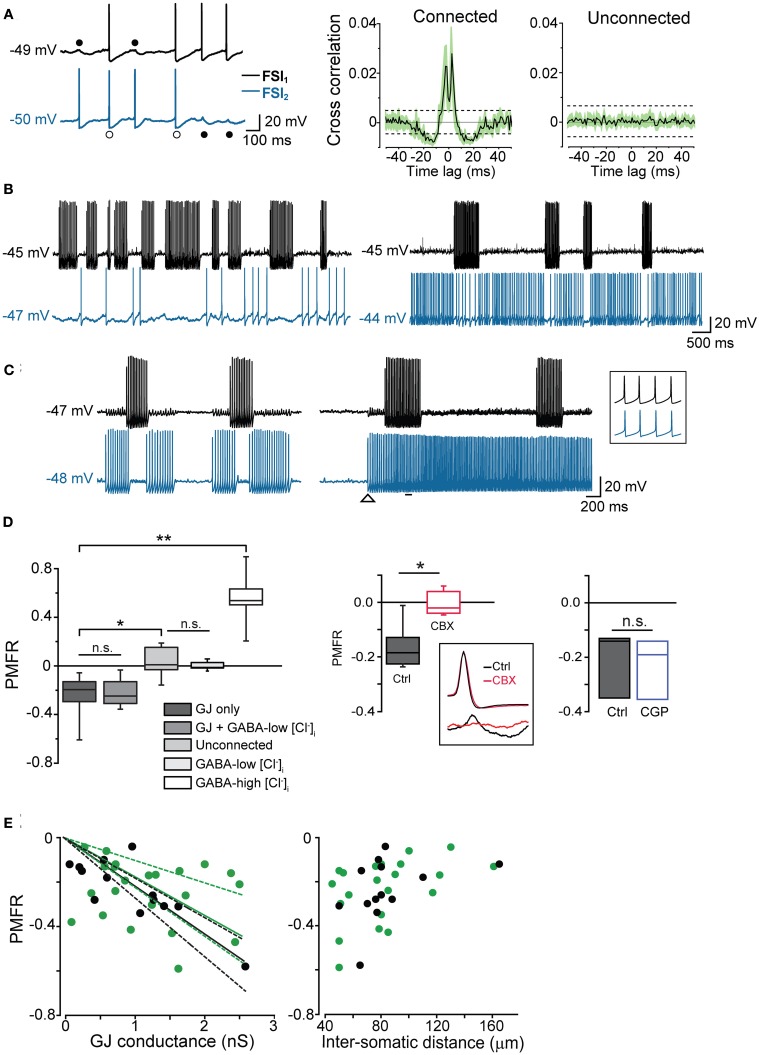
Figure 4.
GJ mediate inhibition in coupled interneurons at high-frequency presynaptic spike firing. (A) In order to induce prolonged episodes of firing activity at low frequency (in this case 8 Hz in both cells), two electrically connected FSIs (without GABAergic synapses) were injected with a relatively small suprathreshold DC (200–250 pA) through the recording electrodes for 1–2 min. Two-second recording segments are shown here starting 5–10 s after the onset of current injection. Left, individual spikes either elicited an AP (white circles) or a spikelet (black circles) in the paired FSI. Right, average cross-correlograms for connected and unconnected pairs (n = 11 and 6, respectively). Shaded areas and dashed lines represent s.e.m. and average confidence intervals equal to two standard deviations of the spike trains, respectively (B) Left, burst-like firing episodes in FSI1 (Iinj: 430 pA; intra-burst frequency: 38 Hz) were associated with silent periods in FSI2 when the latter was stimulated just above firing threshold (Iinj: 310 pA; average spike frequency: 1.8 Hz). Right, in the same pair, FSI2 was injected with stronger DC (Iinj: 370 pA) to increase the firing frequency (~20 Hz). Spike trains in FSI1 were still able to induce a reduction of firing activity in FSI2. (C) Left, spike inhibition resulted in alternated burst firing in two electrically connected FSIs. Right, in the same pair, the inhibitory effect was overrun by a strong increase in firing frequency in FSI2 (from 29 to 52 Hz; Iinj was increased from 380 to 430 pA at the instant indicated by the arrowhead). The inset shows synchronous spikes in a magnified time window indicated by the horizontal bar. (D) Left, box-plot summary of Pearson's mean firing rate coefficient values (PMFR) for connected and unconnected FSI pairs (*p < 0.05, **p < 0.01, n.s.: not significant at p > 0.05, unpaired t-test). Right, box plot summarizing the effect of CBX (200 μ M) and CGP52432 (5 μ M) relative to paired controls (*p < 0.05, n = 5; n.s.: p > 0.05, n = 3, Wilcoxon signed rank test). The inset shows the inhibitory effect of CBX on spikelet (bottom) but not AP waveforms (top). (E) PMFR values plotted against GJ conductance (left) and inter-somatic distance (right) for pairs connected by GJ-only (green circles) and GJ + GABA (black circles). Data sets are the same as the ones used for box plots in (D). Solid lines are linear regression fits of the respective data sets (dashed lines represent confidence bands at 95% level).

