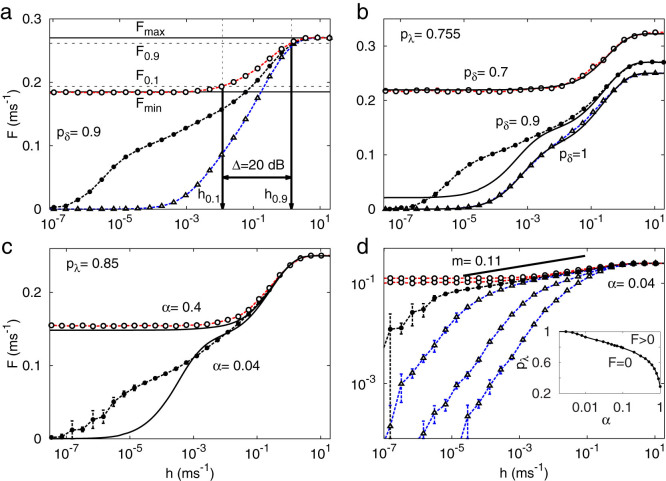
Figure 3. Response functions and phase diagram.
(a), Response curves F(h) for pλ = 0.5, 0.755, 1 (from right to left). Horizontal lines and vertical arrows show the relevant parameters for calculating the dynamic range Δ (see Eq. (2)). (b), Response curves dependence on pδ for homogeneous distribution smelt  . Symbols connected by dashed lines represent simulation results whereas continuous lines represent the generalized excitable-wave (GEW) mean-field approximation. (c) and (d), Response curves dependence on g, i.e.,
  . (d), Family of response curves for pλ = 0.4, 0.6, 0.8, 0.85, 0.9, 1 (from right to left). Solid line represents a power law with exponent m = 0.11, which serves as a guide to the eye for the simulation results for the critical value pλ = 0.85. Inset: phase diagram. Tree size is G = 10 for all panels.

