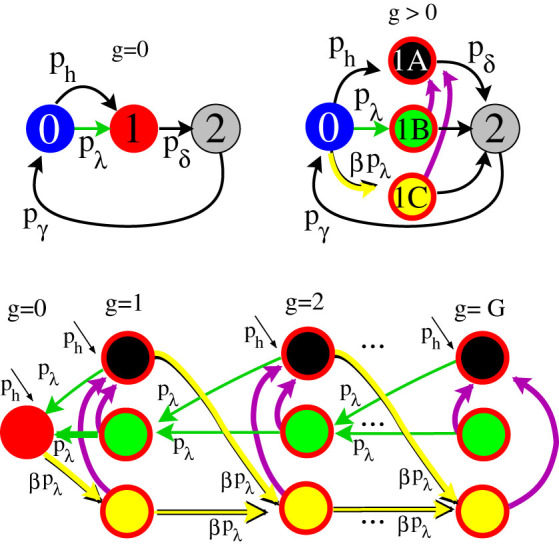
Figure 6. Generalized excitable-wave mean-field approximation.

Top-left panel illustrates the dynamics of each node and of layer g = 0 under the GEW mean-field approximation. Top-right panel illustrates the dynamics of further layers under the GEW mean-field approximation. Bottom panel shows the excitable-waves direction of propagation. Notice that in the absence of purple arrows the flux vanishes in the state (1C) of the last layer. The purple arrows represent transitions that occur at each time step with probability (1 − pδ)2 (see text for details). This generalization allows a qualitative description of the system for pδ < 1.
