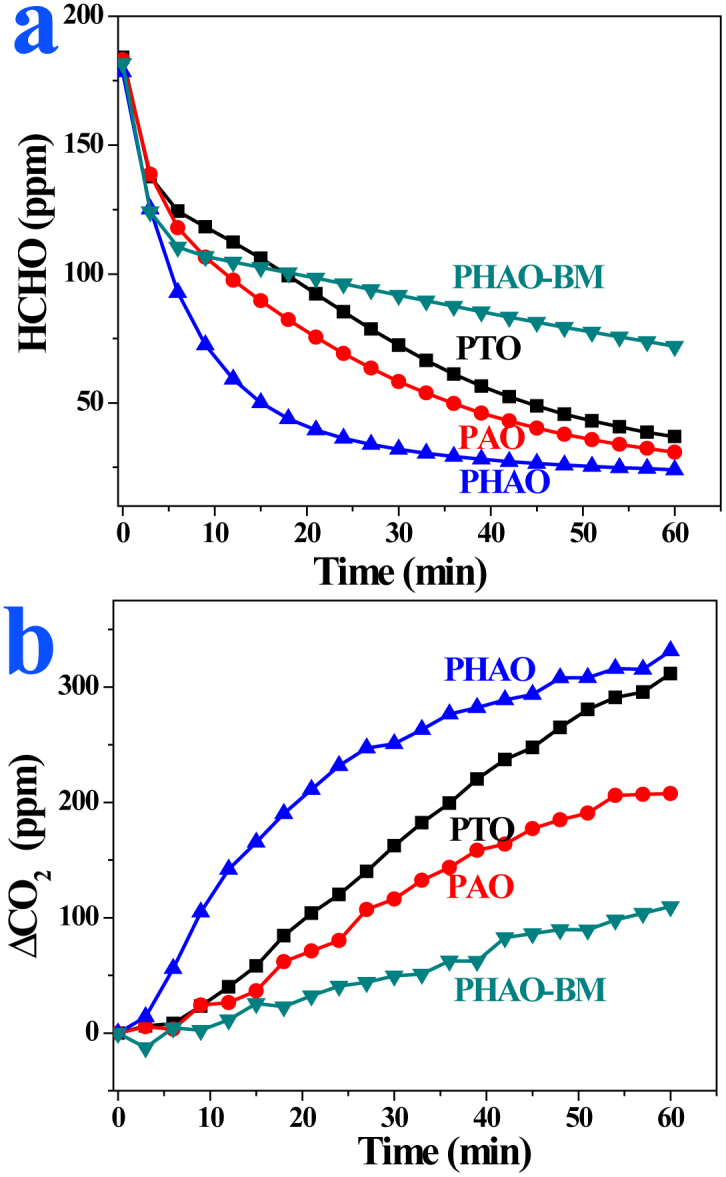
Figure 3. Catalytic performance.

Concentration changes of formaldehyde (a) and ΔCO2 (the difference between CO2 concentration at t reaction time and initial time, ppm) (b) as a function of reaction time for the PHAO, PAO, PTO and PHAO-BM samples.

Concentration changes of formaldehyde (a) and ΔCO2 (the difference between CO2 concentration at t reaction time and initial time, ppm) (b) as a function of reaction time for the PHAO, PAO, PTO and PHAO-BM samples.