
Figure 2. Mag reduces the invasion, migration, and adhesion of MDA-MB-231 cells.
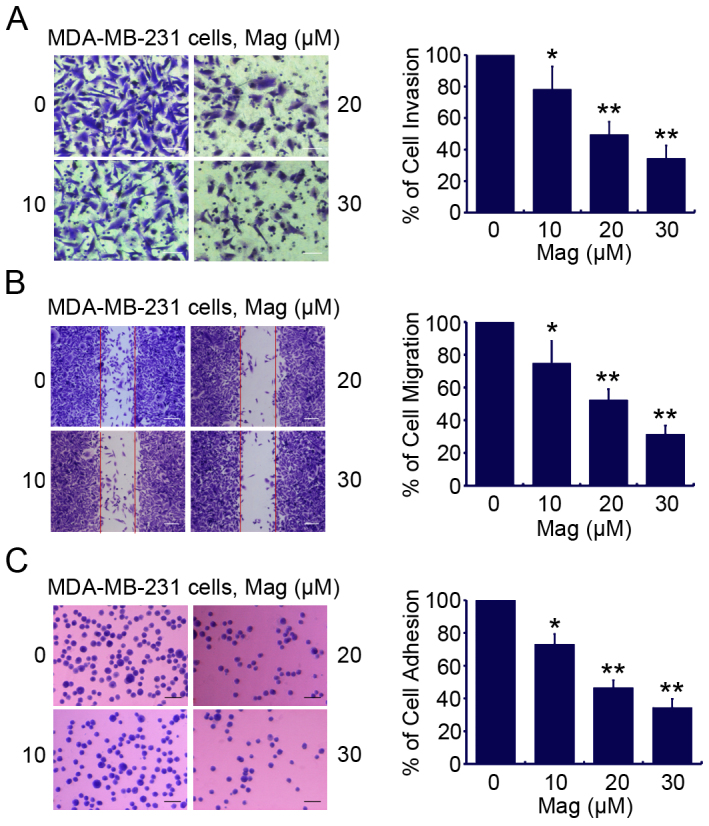
(A): Invasion assay was carried out using modified 24-well microchemotaxis chambers. Then randomly chosen fields were photographed (×100), and the number of cells migrated to the lower surface was calculated as a percentage of invasion. Scale bar = 200 μm. Data are shown as the mean ± SD of three independent experiments by analysis of Student's t test. *, P < 0.05, **, P < 0.001, vs 0 μM. (B): Confluent cells were scratched and then treated with Mag in a complete medium for 24 h. The number of cells migrated into the scratched area was photographed (×40) and calculated as a percentage of migration. Scale bar = 300 μm Data are shown as the mean ± SD of three independent experiments by analysis of Student's t test. *, P < 0.05, and **, P < 0.001, vs 0 μM. (C): Cells were seeded in a 96-well plate coated with matrigel and treated with Mag. Attached cells were photographed (×100) after crystal violet staining, and the number of attached cells was quantified by measuring O.D.. Scale bar = 80 μm. Data are shown as the mean ± SD of three independent experiments.*, P < 0.01, **, P < 0.001 vs 0 μM.