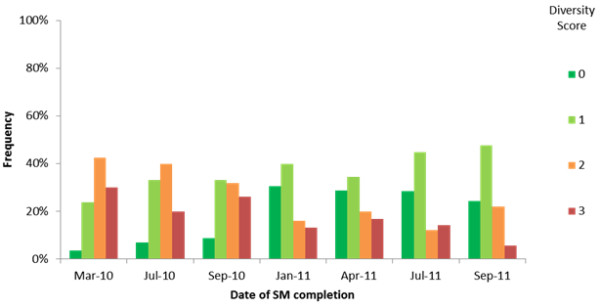
Figure 4.

‘Diversity of opinion’ analysis. At each point in time, the distribution shows the frequency of occurrence of each diversity score from 0 (full agreement) to 3 (maximum diversity of opinion). Distributions that are positively skewed (higher frequencies in low scores) indicate less diversity of opinion than negatively skewed distributions (higher frequencies in high scores).
