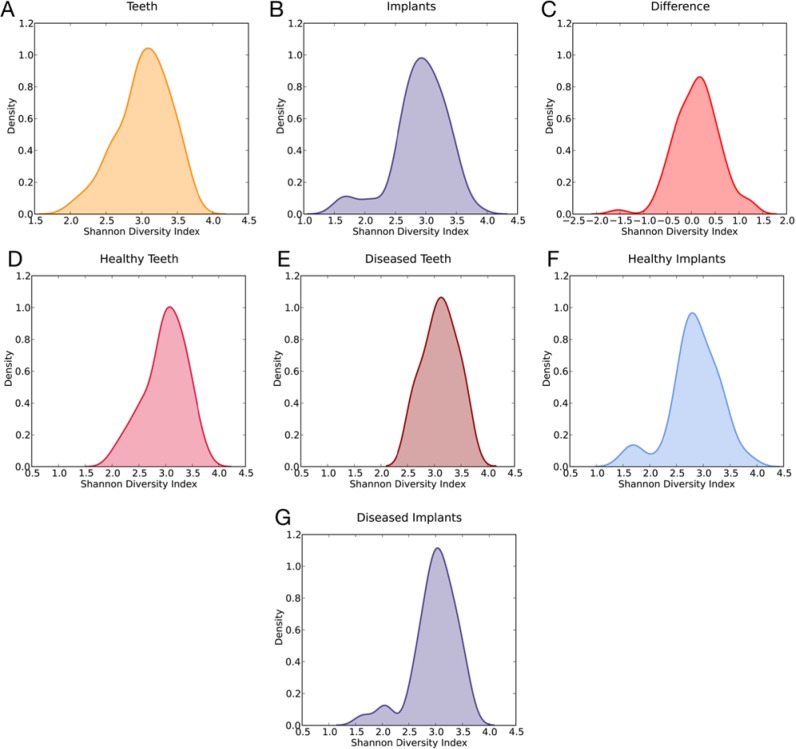
Figure 2.
Shannon Diversity Index. (A) Teeth. (B) Implants. (C) Teeth minus implants. The difference between the 2 distributions was significant (p < .05, Wilcoxon signed-rank test) in favor of the teeth. (D-G) Shannon Diversity indices by health status. Statistically significant difference was found only in the HT/HI group (p < .05, Wilcoxon signed-rank test).

