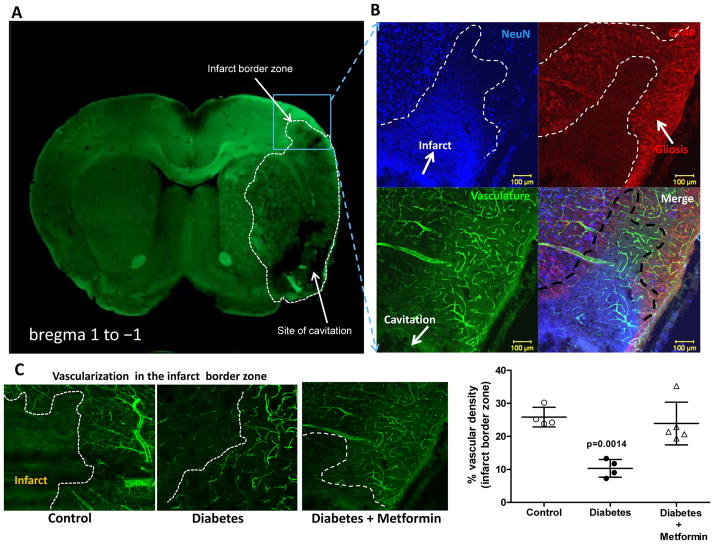
Figure 2.
Diabetes impairs post stroke cerebral neovascularization at the infarct border zone. (A) Representative image depicting the localization of the infarct border zone. (B) Representative images comparing vascular density at infarct border zone taken under 10X objective. (C) Graphical representation of the % vascular density around the area of infarction in all the groups. Mean ± SEM, n=4–6.

