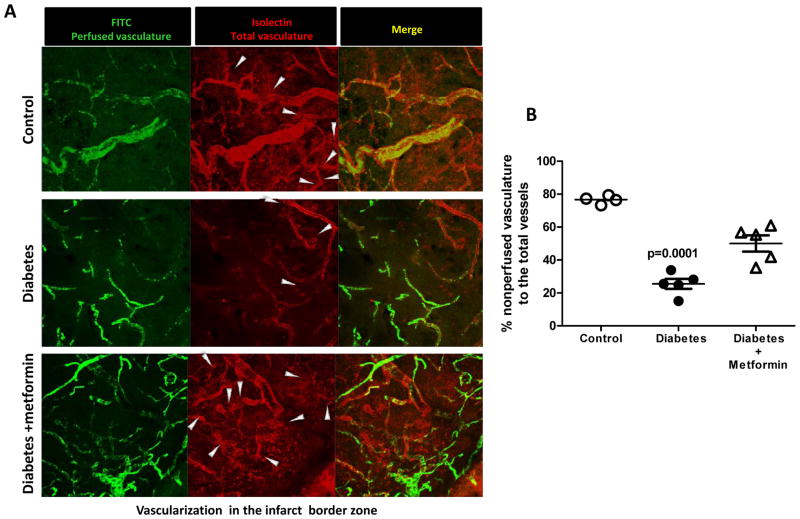
Figure 3.
Diabetes decreases isolectin staining (red, nonFITC-perfused vessels) after stroke indicating impairment of new vessel formation. (A) Representative images comparing non-perfused vessels at day-14 in the infarct border zone imaged using a 63X objective. White arrows represent the non-perfused vessel islands protruding from the perfused vessels (B) Graphical representation of the % nonperfused vasculature in the peri-infarct zone in all the groups. Mean ± SEM, n=4–5.

